Why Most Websites Don’t Convert (And What the Data Actually Shows)
Data-driven conversion pages are web pages built and improved using real user data — not guesswork — to turn more visitors into customers, leads, or subscribers.

Here’s a quick breakdown of what makes a page “data-driven”:
| Element | What It Means |
|---|---|
| Audience data | Using segmentation and personas to match content to the right visitor |
| Behavioral data | Heatmaps, session recordings, and funnel analysis showing what users actually do |
| Testing | A/B tests that replace assumptions with evidence |
| Performance metrics | Tracking conversion rate, bounce rate, and ROI to measure what’s working |
| Continuous iteration | Using results to improve pages over and over — not just once |
Most websites don’t have a traffic problem. They have a conversion problem.
Only 22% of businesses are satisfied with their conversion rates. And yet, the fix is often closer than you’d think. Using the right targeting and testing methods can increase landing page conversions by up to 300%. Personalized content alone can boost conversion rates by 90%.
The gap between a page that struggles and a page that converts usually comes down to one thing: are you following the data, or following your gut?
Data tells you what your visitors actually want. Your gut tells you what you think they want. In marketing, those two things are rarely the same.
I’m Jillyn Dillon, founder of Technology Aloha and a former Senior Competitive Intelligence Analyst at Northrop Grumman, where I built data-driven strategy frameworks presented directly to C-suite executives — the same systems-thinking approach I now apply to building data-driven conversion pages for small businesses. Let’s walk through exactly how to do it.
Core Principles of Data Driven Conversion Pages
Building a page that actually converts requires a shift in mindset. We aren’t just making things look “pretty.” We are building a high-performance machine fueled by information. The first core principle is simple: stop treating every visitor the same.

Audience Segmentation and Personas
The foundation of any successful page is knowing exactly who is landing on it. 89% of marketers worldwide use data to make their strategic decisions, and for good reason. When we segment our audience, we divide them into groups based on specific criteria like:
- Demographics: Age, gender, and income.
- Geolocation: Where they are located (crucial for local businesses in places like Kahului).
- Behavior: What they’ve clicked on before or how many times they’ve visited.
- Device: Whether they are browsing on a high-end desktop or a mobile phone on the go.
By creating detailed buyer personas, we can move away from “one-size-fits-all” messaging. Research shows that personalized messages increase conversion rates by 90%. If you aren’t speaking directly to a specific person’s needs, you’re just adding to the digital noise.
Building a Data-Driven Content Strategy
Once we know who we are talking to, we need to decide what to say. A data-driven content strategy focuses on the “Reverse Pyramid” model: put the most important information first. Users typically only read 20–28% of the words on a page, so your value proposition needs to be clear within the first 8 seconds.
To increase your website conversions, your content must address four key areas:
- Value Proposition Clarity: Why should they choose you over a competitor?
- Content Hierarchy: Use H1-H6 tags to guide the eye and make the page skimmable.
- High-Quality Standards: Content should be informative, relevant, and engaging.
- Objection Handling: Use data from customer support or FAQs to answer common hesitations directly on the page.
Don’t forget the essentials for your product pages, such as clear pricing and high-quality visuals. Data shows that embedding videos on a landing page can increase conversion rates by approximately 80%.
Implementing Personalization on Data Driven Conversion Pages
Personalization is no longer just “nice to have.” According to McKinsey, personalizing content can increase revenue by 5-15%. On data driven conversion pages, this looks like dynamic content that changes based on the user’s journey.
For example, if a visitor arrives via a specific Facebook ad about “eco-friendly web design,” the headline on your landing page should reflect that exact interest. You can also use geolocation to show local testimonials or “free shipping to Hawaii” banners. Tailoring user journeys ensures that the visitor feels seen and understood, which significantly lowers the barrier to conversion.
Leveraging Behavioral Data and Testing for Maximum Impact
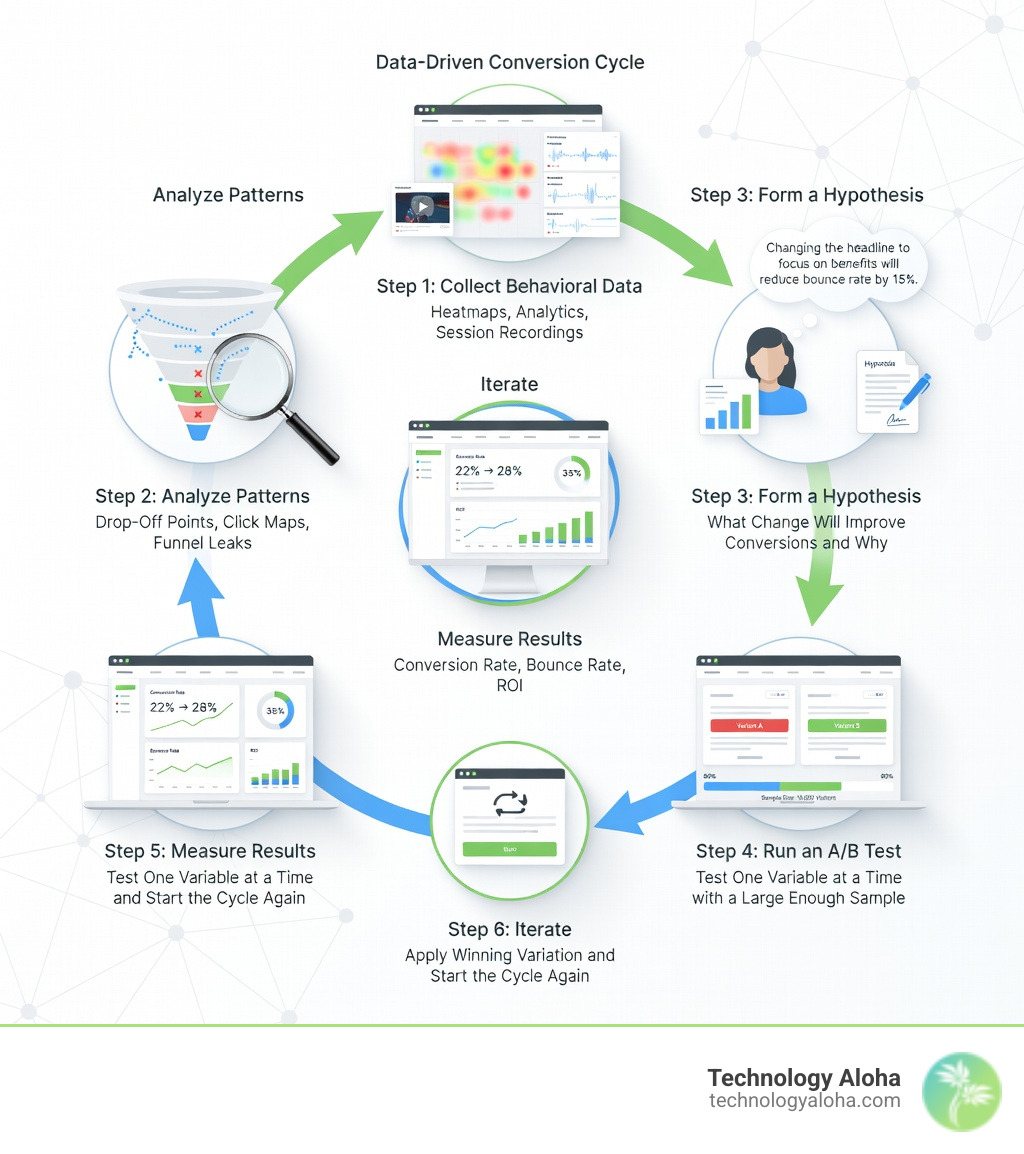
If you want to know why people aren’t clicking your buttons, you have to watch them. Behavioral data is the “secret sauce” of CRO. It moves us past what people say they do and shows us what they actually do.
Analyzing User Behavior Insights
We use several tools to peer into the minds of our visitors.
- Heatmaps: These show where users click, move their mice, and scroll. If your most important information is in a “cold” (unclicked) area, you have a problem.
- Scroll Depth: Are people leaving before they even see your offer? If they only scroll 25% of the way down, your CTA needs to move up.
- Session Recordings: Watching a real user struggle to find a menu item is the fastest way to identify “dead clicks” and friction points.
- Funnel Analysis: This identifies exactly where users drop off. If 70% of people leave at the shipping info page, your shipping costs or form length are likely the culprits.
Using user feedback loops allows us to ask visitors why they are leaving through exit-intent surveys, providing qualitative data that numbers alone can’t give.
Running Effective A/B Tests on Data Driven Conversion Pages
A/B testing, or split testing, is the process of comparing two versions of a page to see which performs better. This is how we measure marketing success with confidence.
When running tests, we follow the PIE framework:
- Potential: How much improvement can be made on this page?
- Importance: How valuable is the traffic to this page?
- Ease: How difficult is it to implement the test?
Common elements to test include CTA copy, headlines, and images. For instance, did you know that changing a button from “Submit” to “Get My Free Guide” can increase clicks by over 200%? Always test one variable at a time to ensure your results are statistically significant. Failure to A/B test could cost you a potential 228% increase in conversions.
Technical and Psychological Tactics to Boost Credibility
A page can have great copy and still fail if it’s slow or looks untrustworthy. Technical performance and psychological “trust signals” are the pillars that support your marketing message.
Optimizing User Experience on Data Driven Conversion Pages
User experience (UX) isn’t just about aesthetics; it’s about speed and ease of use.
- Page Load Speed: A one-second delay in page response can result in a 7% reduction in conversions. 47% of consumers expect a page to load in 2 seconds or less. You can check your stats using Google PageSpeed Insights.
- Mobile Optimization: With over 58% of global traffic coming from mobile, optimizing for mobile is a necessity. Ensure your tap targets are at least 44×44 pixels so people with “fat thumbs” don’t get frustrated.
- F-Shaped Reading Pattern: Most users scan pages in an ‘F’ shape. Place your most important data and CTAs along these scanning lines.
To keep users focused, we recommend minimizing distractions. Removing the navigation menu from a landing page has been shown to increase conversions by 100% because it gives the user only one path forward.
Boosting Credibility with Trust Signals
People buy from businesses they trust. Data-driven pages use social proof beacons to build that trust instantly.
- Testimonials and Reviews: 88% of people trust online reviews as much as personal recommendations. Including user-generated content can increase conversion rates by 161%.
- Trust Badges: Displaying SSL certificates and secure payment icons (like those from SSL.com) reduces “purchase anxiety.”
- Video Marketing: As we mentioned, video can significantly boost conversions by putting a human face to your brand.
Streamlining the Path to Purchase
Every extra field in a form is a chance for a customer to leave. Streamlining conversion funnels is about removing friction.
- Minimize Form Fields: Optimizing contact forms can increase conversion rates by up to 25%.
- Guest Checkout: Don’t force people to create an account to buy from you.
- Progressive Profiling: Collect data over time rather than all at once.
- Exit-Intent Pop-ups: Use exit-intent technology to offer a discount or a lead magnet just as a user is about to leave.
Measuring Success with Key Performance Indicators
You can’t improve what you don’t measure. To truly understand if your data driven conversion pages are working, you need to look at the right KPIs.
| Metric | Why It Matters | Benchmark |
|---|---|---|
| Conversion Rate | The % of visitors who take the desired action. | 2–5% (Average), 10%+ (Top Tier) |
| Bounce Rate | The % of visitors who leave after seeing only one page. | Under 40% is excellent. |
| ROI Ratio | For every $1 spent, how much revenue is generated? | 2:1 is the minimum goal. |
| CAC | Customer Acquisition Cost. How much does it cost to get one customer? | Varies by industry. |
| Time on Page | Indicates if your content is actually being read. | Higher is usually better for long-form. |
Understanding your website analytics is about more than just looking at “hits.” It’s about looking at trends. Use Google Analytics to track these metrics over time. If your bounce rate is high but your time on page is also high, it might mean people are reading your content but don’t know what to do next (a CTA problem).
Frequently Asked Questions about Conversion Optimization
What is a good conversion rate benchmark across industries?
A “good” conversion rate is relative. While the average e-commerce rate is 2–3%, top-performing stores often hit 5–10%. However, at Technology Aloha, we believe a good rate is one that is better than your rate last month. Your historical data and ROI requirements are much more important than a generic industry average. If your product has a high price point (like $5,000), a 1% conversion rate might be fantastic.
How do I calculate my website’s conversion rate?
The formula is simple: (Total Conversions / Total Unique Visitors) x 100 = Conversion Rate % For example, if you had 50 sales from 1,000 visitors, your conversion rate is 5%. To do this accurately, you must have goal tracking set up in your analytics tools.
Which tools are best for collecting user behavior data?
We recommend a “stack” of tools for the best results:
- Google Analytics 4 (GA4): For high-level traffic and goal tracking.
- Hotjar or Crazy Egg: For heatmaps and session recordings.
- Optimizely or VWO: For running A/B tests.
- Google PageSpeed Insights: For monitoring technical performance.
What are the key takeaways for building data-driven conversion pages?
Building data driven conversion pages isn’t a “one-and-done” project. It’s a culture of continuous iteration. By replacing guesses with data, you stop wasting your marketing budget and start building a website that works as hard as you do.
At Technology Aloha, we specialize in this exact blend of cohesive branding and high-conversion design. Whether you are in Kahului or anywhere else in Hawaii, we use these data-driven insights to help your business grow strategically.
Ready to stop guessing and start converting? Our experts are here to help you build a marketing strategy that actually delivers results. Contact us today to see how we can turn your data into dollars!